
How Cybersecurity KPIs, Automation & Cloud-Orchestrated Dashboards Will Decide Who Survives 2025–2026**
By Khadim Hussain
Chapter 1 — The Cyber Crisis No Executive Sees Coming
I am sitting here at my desk — coffee cooling, fingers tapping — and I am staring at the greatest delusion of modern business:
Executives think they know their cybersecurity posture.
They think they’re safe.
They think their teams have visibility.
They think they’re prepared.
But in truth?
They are blind.
Not because they lack data —
but because they have mountains of it.
Piles. Silos. Timelines. Dashboards. Alerts. Logs. Threads.
So much data that the truth is lost inside the noise.
And somewhere inside that noise…
a threat is crawling.
A breach is expanding.
An incident is escalating.
An SLA is being violated.
A critical alert is aging.
A severity-1 case is sitting untouched.
A compliance metric is quietly drifting out of bounds.
And no one sees it.
Not because they don’t want to.
Not because they lack talent.
But because they lack the one thing that matters in cybersecurity:
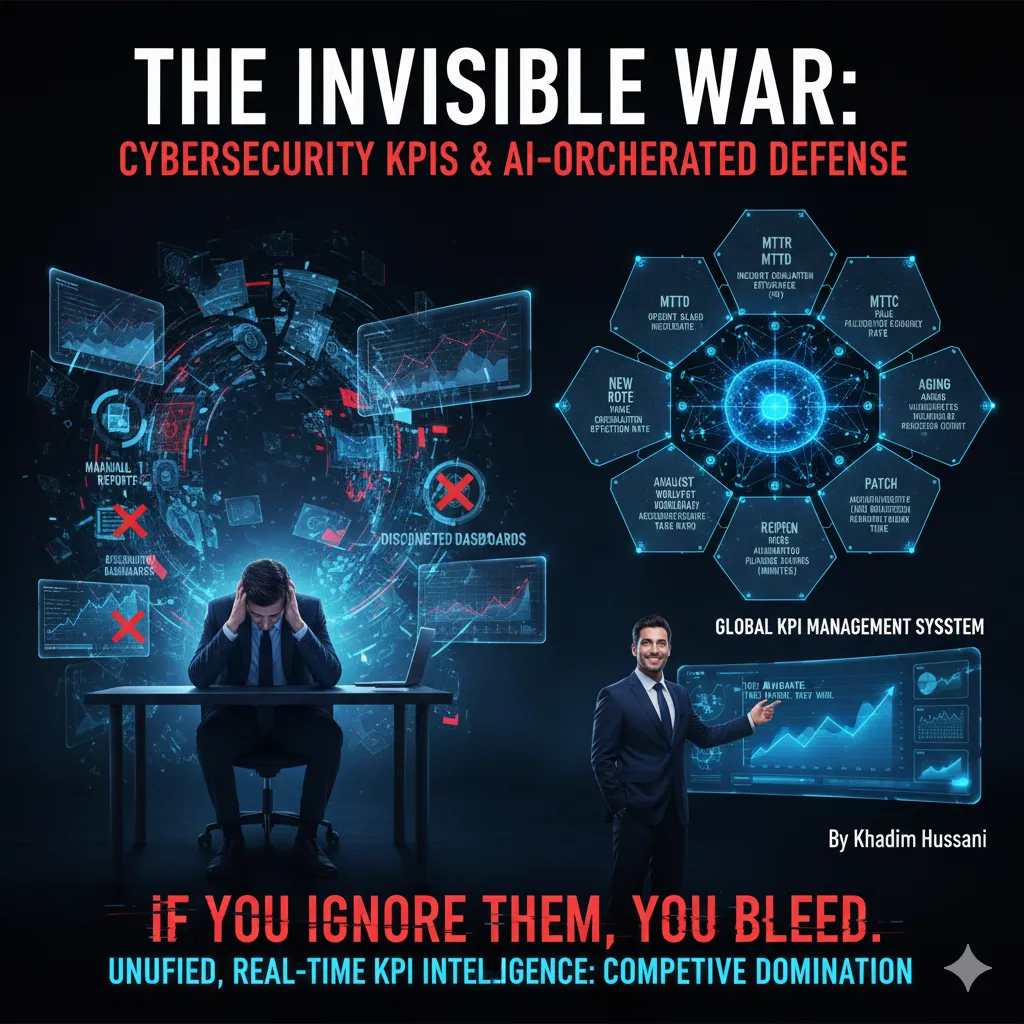
Unified, real-time KPI intelligence.
This — right here — is why 2025 and 2026 will be years of extraordinary collapse for organizations who still depend on:
❌ Manual reports
❌ Disconnected dashboards
❌ Siloed SOC teams
❌ Spreadsheets
❌ Fragmented KPIs
❌ And “best guesses”
These companies will lose.
Not to competitors.
Not to marketplace shifts.
But to the silent, merciless arithmetic of cyber failures they never saw coming.
And so, today, I will show you — with brutal clarity — exactly how cybersecurity KPI mastery becomes the defining leadership advantage of our age.
Let us begin.
SECTION 1 — The Top 20 Cybersecurity KPIs Every Organization Must Track in 2025–2026
If you monitor these, you survive. If you ignore them, you bleed.
I have reviewed thousands of SOC failures, breach reports, audit findings, and incident timelines. The same pattern repeats:
Organizations track everything except the KPIs that matter.
So let us cut through the noise.
Let us eliminate vanity metrics, useless dashboards, and irrelevant charts.
Here are the 20 KPIs that determine survival:
Incident Response KPIs (Your Lifeline)
- MTTR (Mean Time to Respond)
The single greatest indicator of cyber resilience. - MTTD (Mean Time to Detect)
If your detection time is slow, nothing else matters. - MTTC (Mean Time to Contain)
The difference between a minor inconvenience and a catastrophic breach. - Incident SLA Compliance (%)
How often your team actually responds within the promised time. - Open vs Closed Incidents
If your backlog grows — your risk grows.
Threat Intelligence KPIs (Your Radar System)
- Threat Correlation Efficiency
How well your system connects events across sources. - False Positive Rate
High false positives = analyst burnout = missed real threats. - New IOC (Indicators of Compromise) Ingestion Rate
How quickly your intelligence integrates into your system.
SOC Operations KPIs (Your Engine Room)
- Analyst Workload Distribution
Uneven workload = slow MTTR. - Severity Distribution Across All Incidents
If high-severity cases increase, your environment is decaying. - Escalation Rate (%)
Shows how many incidents Level 1 cannot handle. - Reopen Rate (%)
Reopened cases = poor root-cause handling.
Automation Metrics (Your Force Multiplier)
- Automated vs Manual Task Ratio
SOCs that automate win wars.
SOCs that don’t burn out. - Automated Playbook Success Rate
If automation fails, you lose speed AND accuracy. - Average Automation Savings (Minutes per Incident)
The KPI that shows automation value in dollars, not theory.
SLA, Cost & Efficiency KPIs (Your Business Reality)
- Cost Per Incident
CFOs love this — and so should CISOs. - Aging Incidents (High Severity)
The most dangerous KPI in your entire SOC. - Containment SLA Breach Count
One breach can trigger regulatory pain. - Patch & Vulnerability Remediation Time
If this KPI is slow, attackers walk right in. - Security Control Failure Rate
The beating heart of system-wide resilience.
If you track these KPIs, you see the whole battlefield.
If you don’t, you fight blindfolded.
And now that you know what to measure — let us explore how to see it in real time.
SECTION 2 — How to Use Cloud-Orchestrated Dashboards to Monitor Cybersecurity Health
I want you to imagine something.
You are sitting in your SOC.
But instead of twenty screens, dozens of dashboards, and endless tabs —
you have ONE unified cloud-orchestrated dashboard.
Every widget alive.
Every KPI breathing.
Every incident pulsing in real time.
This, my friend, is the dashboard architecture described in the Cloud SOAR transcript you provided.
And it works because of five key elements:
1. Widgets: The Building Blocks of Cyber Intelligence
Widgets are not charts.
They are not graphics.
They are not decorations.
They are windows into the state of your cyber health.
Bar charts.
Tables.
Graphs.
Heat maps.
Severity matrices.
Time-series incident patterns.
Each widget is its own battlefield map.
2. Drilldowns: The Truth Beneath the Surface
Eugene Schwartz believed in going deeper — always deeper — to uncover the mechanisms that drive results.
Drilldowns do exactly this.
You click a widget.
You drop instantly into:
- The incident
- The timeline
- The evidence
- The IPs
- The logs
- The automation executed
- The playbooks activated
Drilldowns eliminate the guesswork.
They eliminate analyst debates.
They eliminate “I think” and replace it with “Here is the proof.”
3. Time-Range Analysis: The KPI X-Ray Machine
With one click, analysts can zoom out:
- Last hour
- Last 24 hours
- Last 7 days
- Last 30 days
- Custom ranges
Why does this matter?
Because patterns matter. Trends matter. Aging matters.
Without time-range analysis, you are staring at static data — not intelligence.
4. Auto-Refresh Monitoring: Real Time or Nothing
The Cloud SOAR architecture includes auto-refresh — a feature too many organizations underestimate.
Cyber incidents evolve by the minute.
A dashboard that refreshes manually is already outdated.
Auto-refresh transforms your KPI dashboard into a real-time SOC heartbeat:
Every second updated.
Every widget alive.
Every threat visible.
5. Unified Orchestration: The Mechanism Behind It All
This is the heart of the system — the mechanism that makes the entire dashboard world-class:
Orchestration. Automation. Integration. One engine.
Cloud orchestration pulls data from everywhere:
- SIEM
- SOAR
- Threat intel
- EDR
- Firewalls
- Applications
- Logs
- Identity systems
- Cloud platforms
It unifies the data.
Normalizes the data.
Correlates the data.
Visualizes the data.
Without orchestration, dashboards are pretty charts.
With orchestration, dashboards are weapons.
SECTION 3 — How to Choose the Right KPIs for Cybersecurity Incident Response
Choosing KPIs is not about numbers.
It is about truth.
The truth of how fast your team detects danger.
The truth of how quickly you respond.
The truth of how well automation works.
The truth of where your blind spots hide.
Let me give you the five KPIs that matter more than anything else in incident response:
1. MTTR — Mean Time to Respond
If this metric is high, you are losing the war.
2. MTTD — Mean Time to Detect
Detection speed is destiny.
3. Open vs Closed Incidents
Backlog = breach risk.
4. SLA Breach Count
Every breached SLA is a neon sign pointing to system failure.
5. Severity Distribution
If your high-severity incidents climb, you are slipping.
These KPIs tell you:
- Where you are vulnerable
- Where your analysts are stretched
- Where automation can save you
- Where leadership must intervene
- Where threats are evolving faster than your SOC
Without these KPIs, incident response is a guessing game.
With them, it becomes a precision instrument.
SECTION 4 — KPI Reports for Cybersecurity Teams: How to Build, Export & Automate Them
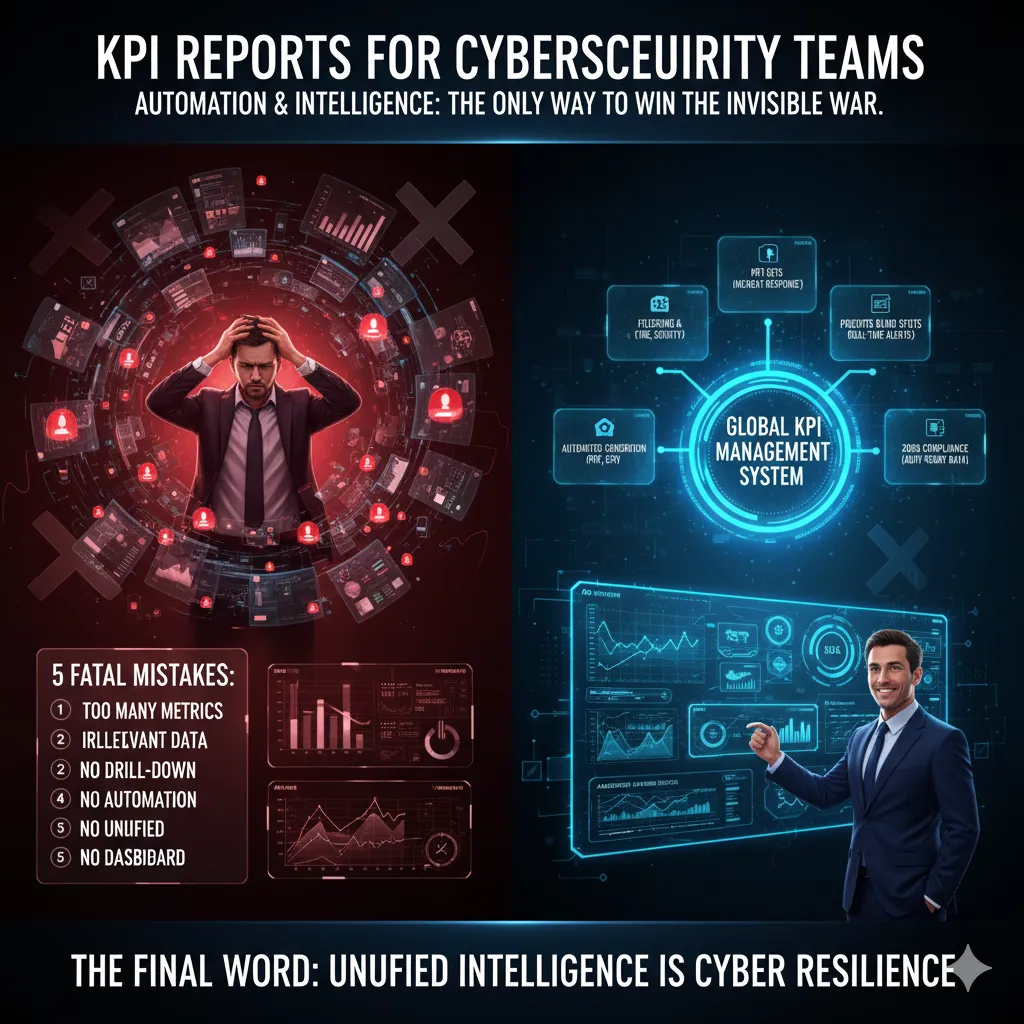
Now we move into the territory that separates amateurs from mature cybersecurity leaders:
KPI report automation.
Because manual reporting is slow.
It is error-prone.
It is blind — fatally blind.
But Cloud SOAR gives you:
- KPI templates
- KPI sets
- Field selectors
- Filtering tools
- Export engines
- Automated report generation
And this changes everything.
1. How KPI Sets Work
A KPI set is a preconfigured cluster of metrics.
For example:
- “Incident Response KPIs”
- “Automation KPIs”
- “SOC Operations KPIs”
- “Executive KPI Summary”
You select the set.
The system remembers your preferences.
Next time — one click. Report done.
2. Filtering & Field Selection
You choose:
- Time ranges
- Incident types
- Severity levels
- Playbooks used
- Geography
- Teams
- Fields to include or hide
This is how you build a report that answers the right questions.
3. Report Generation & Export
This is where the magic happens:
- One click
- The system aggregates the data
- Correlates
- Normalizes
- Builds
- Exports
PDF, CSV, Excel, JSON — whatever leadership needs.
4. Why Automation Prevents Blind Spots
Because human beings forget.
They overlook.
They miss patterns.
They miscalculate.
They skip steps.
Automated KPI reports do not.
Automation destroys blind spots.
It reveals the truth — even the uncomfortable truth.
And in cybersecurity, the truth is the only thing that can save your organization.
SECTION 5 — The Top Mistakes Organizations Make in Cybersecurity KPI Tracking
Let me be brutally honest.
Most organizations fail in cybersecurity not because they lack tools —
but because they measure the wrong things, in the wrong way, with the wrong structure.
Here are the 5 fatal mistakes:
1. Tracking Too Many Metrics
A drowning man does not need more water.
A drowning SOC does not need more dashboards.
Focus is survival.
2. Tracking Irrelevant Metrics
Vanity metrics kill clarity.
Clarity saves organizations.
3. No Drill-Down Capability
If you cannot click deeper, you cannot see truth.
4. No Automation
Manual reporting is slow reporting.
Slow reporting leads to missed threats.
5. No Unified Dashboard
The greatest cybersecurity failure of all:
Data lives in ten places, but danger lives in one.
Unless all your KPIs live in a single pane of glass…
you will lose the cyber war.
THE FINAL WORD — AND THE ONLY REAL SOLUTION
I have spent my life studying persuasion —
the psychology of attention —
the mechanics of decision-making.
And here is the hard truth:
Organizations do not fail because they lack technology.
They fail because they lack visibility.
Cybersecurity is not a tool problem.
It is not an analyst problem.
It is not a threat problem.
It is a KPI problem.
A visibility problem.
A unified intelligence problem.
And there is only one category of system that solves this:
A Global KPI Management System — powered by orchestration, automation, dashboards, and intelligence.
This is what SustainabilityEngine.cloud delivers.
This is what Cloud SOAR makes possible.
This is what 2026 compliance requires.
This is what cyber resilience demands.
#CybersecurityKPIs #CloudSOARAutomation #CloudSOARAutomation #SecurityOperationsDashboard #KPIMonitoring2026
1 thought on “THE INVISIBLE WAR”
Comments are closed.