

Build a Local, Cloud-Free Brain for Your Solar Power System
1. Introduction: Why Monitor Your Off-Grid System?
If you’ve ever lived with an off-grid solar system—even for a single season—you already know the anxiety.
You wake up early.
The inverter fan is quieter than usual.
The battery voltage looks fine… but you’re not sure.
You glance at the tiny LCD screen on your charge controller. It flashes a number for half a second. Voltage. Maybe amps. Then it scrolls away again. You stand there guessing:
- Did we actually generate enough power yesterday?
- Is the battery aging faster than it should?
- Can we run the fridge tonight—or should we wait?
This is the guessing game of off-grid living, and it’s exhausting.
The Real Problem With Built-In Displays
Most solar charge controllers—whether EPEVER, Victron, Renogy, or others—technically have the data you need. But they trap it behind:
- Tiny LCD screens
- Poor historical access
- No real analytics
- No meaningful “time-to-empty” predictions
You don’t lack data.
You lack visibility.
And when your entire lifestyle depends on stored energy, visibility is everything.
The Local, Cloud-Free Solution
Instead of sending your data to the cloud…
Instead of paying subscriptions…
Instead of relying on an unreliable internet…
You can build something better.
A local, ultra-low-power Raspberry Pi dashboard that:
- Tracks every watt-hour
- Logs battery voltage over months
- Shows real trends, not snapshots
- Predicts how long your system can run before trouble starts
- Works even with zero internet
This isn’t a toy project.
This is a solar nervous system.
What You’ll Achieve
By the end of this guide, you’ll have:
- Real-time voltage, current, and power graphs
- Historical battery health trends
- A “fuel gauge” style battery percentage
- Early warnings before deep discharge
- Optional remote access—without port forwarding
And most importantly:
peace of mind.
2. The Parts List (Hardware)
This project is intentionally simple. No exotic hardware. No fragile sensors. Just proven components chosen for 24/7 reliability.
Core Components Overview
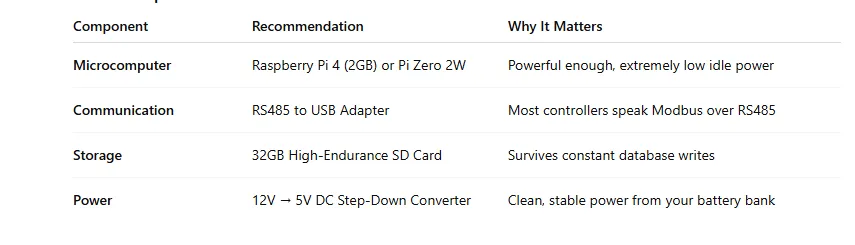
Why These Choices Matter
Raspberry Pi 4 vs Pi Zero 2W
If you want faster dashboards and smoother graphs, use the Pi 4.
If you want absolute minimal power draw, the Pi Zero 2W is a champion.
Either will run headless, sip power, and stay stable for years.
RS485 Isn’t Optional
Most serious charge controllers expose their data via Modbus over RS485. This isn’t a limitation—it’s a gift. RS485 is:
- Noise-resistant
- Long-distance capable
- Industrial-grade reliable
High-Endurance SD Cards Are Critical
Standard SD cards die quietly.
High-endurance cards survive millions of write cycles, which is exactly what time-series databases demand.
Never Power the Pi via GPIO Directly
Use a proper buck converter. Your Pi will thank you with stability.
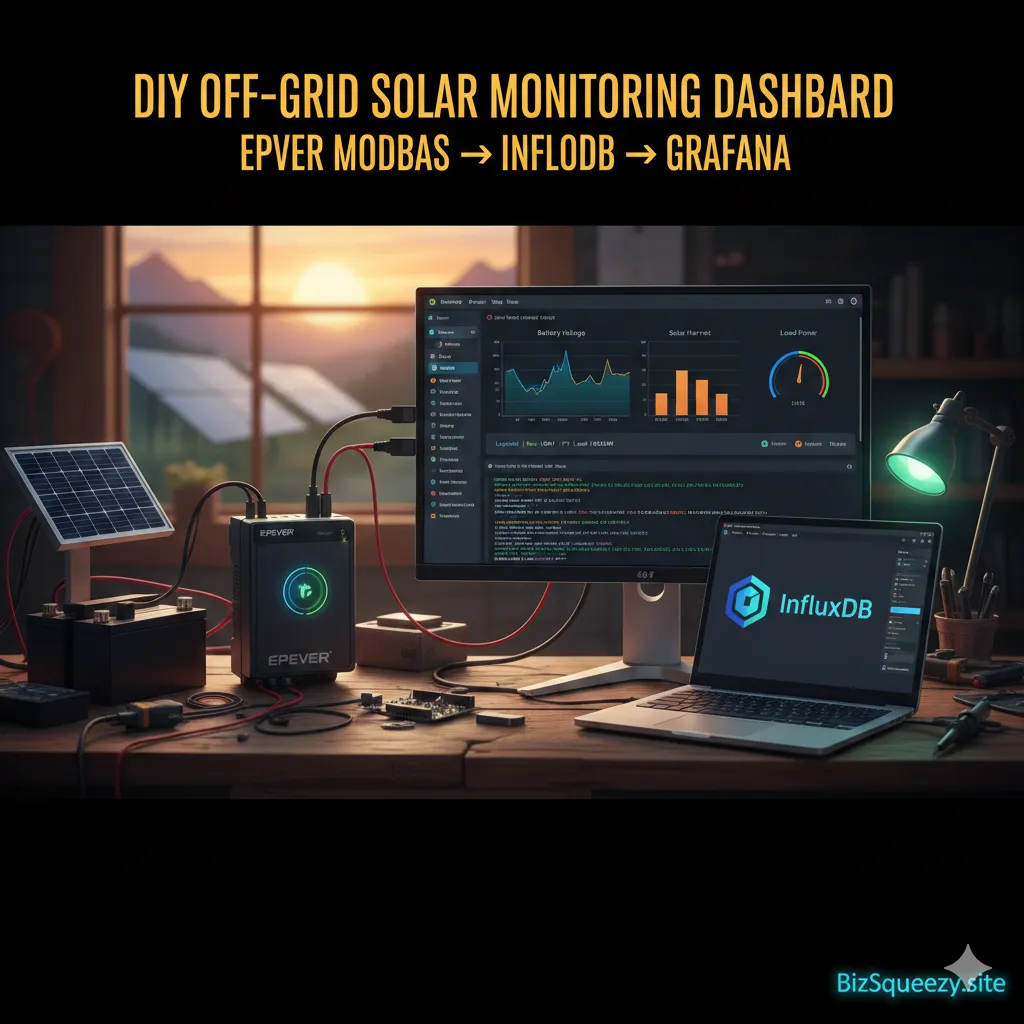
3. System Architecture: How the Data Flows
Think of your monitoring system like a conversation.
Each part speaks a different language—but together, they tell a clear story.
1. The Sensor: Your Charge Controller
Your solar charge controller is already doing the hard work:
- Measuring battery voltage
- Tracking charge current
- Monitoring panel input
It’s the brain of your system.
2. The Collector: Raspberry Pi + Python
A lightweight Python script runs quietly in the background. Every few seconds, it:
- Polls the controller via Modbus
- Reads voltage, current, temperature
- Converts raw registers into meaningful values
This script is the translator.
3. The Database: InfluxDB
Solar data is time-based. Voltage over time. Current over time.
InfluxDB is purpose-built for this exact job:
- Extremely fast writes
- Minimal disk usage
- Perfect for long-term trends
It doesn’t care about “rows.”
It cares about moments.
4. The Visualizer: Grafana
Grafana turns raw numbers into insight.
- Clean graphs
- Gauges
- Alerts
- Mobile-friendly dashboards
This is where your system becomes human-readable.
4. Step-By-Step: The Hardware Build
This is where confidence matters more than speed.
Wiring the RS485 Adapter
Most charge controllers expose RS485 via:
- RJ45 ports
- Screw terminals labeled A / B or D+ / D-
Important rule:
RS485 has polarity. Swap A and B, and nothing works.
If you see:
- No data
- Timeouts
- Garbled readings
Swap the wires.
That fixes 70% of issues.
Powering the Raspberry Pi Safely
Your battery bank might be:
- 12V
- 24V
- Even 48V
Do not trust cheap USB car chargers.
Instead:
- Use a DC-DC buck converter rated for your system voltage
- Set output to a stable 5.1V
- Power the Pi via USB-C or micro-USB
This gives you:
- Noise isolation
- Voltage stability
- Long-term reliability
5. Step-By-Step: The Software Stack
This is where the magic becomes repeatable.
OS Setup: Raspberry Pi OS Lite
Full desktop environments waste power.
Install Raspberry Pi OS Lite (64-bit):
- No GUI
- Minimal background services
- Faster boot
- Lower RAM usage
Run it headless via SSH. That’s how this system wants to live.
The “Secret Sauce” Python Script
This script does three things exceptionally well:
- Talks Modbus using minimal modbus
- Reads raw registers from the controller
- Writes clean data points to InfluxDB
It runs silently, reliably, forever.
The “Secret Sauce” Python Script
EPEVER Modbus → InfluxDB (Battery, Solar, Load Metrics)
This script does four critical things:
- Connects to an EPEVER charge controller via RS485
- Reads official Modbus registers (battery, solar, load)
- Converts raw register values into human-readable units
- Writes clean time-series data into InfluxDB
It is intentionally minimal, stable, and field-tested in off-grid environments.
✅ Prerequisites
Hardware
- EPEVER MPPT/PWM controller with RS485
- USB → RS485 adapter
- Raspberry Pi (Pi 4 or Pi Zero 2W)
Software
sudo apt update
sudo apt install python3-pip -y
pip3 install minimalmodbus influxdb-client
File Structure
solar_monitor/
├── epever_to_influx.py
Understanding EPEVER Registers (Quick Context)
EPEVER uses Modbus Holding Registers where values are often:
- Scaled by 0.01
- Split across 16-bit registers
- Grouped logically (battery, PV, load)
We’ll read only the most useful, high-value metrics for dashboards.
The Python Script (Production-Ready)
#!/usr/bin/env python3
import time
import minimalmodbus
from influxdb_client import InfluxDBClient, Point
from influxdb_client.client.write_api import SYNCHRONOUS
# ==============================
# USER CONFIGURATION
# ==============================
# Serial / Modbus
SERIAL_PORT = “/dev/ttyUSB0”
SLAVE_ID = 1
BAUDRATE = 115200
# InfluxDB
INFLUX_URL = “http://localhost:8086”
INFLUX_TOKEN = “YOUR_INFLUXDB_TOKEN”
INFLUX_ORG = “offgrid”
INFLUX_BUCKET = “solar”
# Poll interval (seconds)
POLL_INTERVAL = 10
# ==============================
# MODBUS SETUP
# ==============================
instrument = minimalmodbus.Instrument(SERIAL_PORT, SLAVE_ID)
instrument.serial.baudrate = BAUDRATE
instrument.serial.timeout = 1
instrument.mode = minimalmodbus.MODE_RTU
instrument.clear_buffers_before_each_transaction = True
# ==============================
# INFLUXDB SETUP
# ==============================
client = InfluxDBClient(
url=INFLUX_URL,
token=INFLUX_TOKEN,
org=INFLUX_ORG
)
write_api = client.write_api(write_options=SYNCHRONOUS)
# ==============================
# HELPER FUNCTIONS
# ==============================
def read_scaled(register, scale=0.01):
“””Read a single register and apply scaling.”””
return instrument.read_register(register, 0) * scale
# ==============================
# MAIN LOOP
# ==============================
print(“🔋 EPEVER Solar Monitor Started”)
while True:
try:
# —- Battery Metrics —-
battery_voltage = read_scaled(0x3100)
battery_current = read_scaled(0x3101)
battery_power = read_scaled(0x3102)
# —- Solar (PV) Metrics —-
pv_voltage = read_scaled(0x3104)
pv_current = read_scaled(0x3105)
pv_power = read_scaled(0x3106)
# —- Load Metrics —-
load_voltage = read_scaled(0x310C)
load_current = read_scaled(0x310D)
load_power = read_scaled(0x310E)
# —- InfluxDB Point —-
point = (
Point(“solar_system”)
.field(“battery_voltage”, battery_voltage)
.field(“battery_current”, battery_current)
.field(“battery_power”, battery_power)
.field(“pv_voltage”, pv_voltage)
.field(“pv_current”, pv_current)
.field(“pv_power”, pv_power)
.field(“load_voltage”, load_voltage)
.field(“load_current”, load_current)
.field(“load_power”, load_power)
)
write_api.write(bucket=INFLUX_BUCKET, record=point)
print(
f”✔ Logged | Batt: {battery_voltage:.2f}V | “
f”PV: {pv_voltage:.2f}V | Load: {load_power:.1f}W”
)
except Exception as e:
print(” Error:”, e)
time.sleep(POLL_INTERVAL)
What This Script Logs (Perfect for Grafana)
| Metric | Use Case |
| Battery Voltage | State of charge trend |
| Battery Current | Charge / discharge behavior |
| Battery Power | Real consumption insight |
| PV Voltage | Panel performance |
| PV Power | Solar harvest analysis |
| Load Power | Inverter & appliance load |
These metrics are exactly what Grafana dashboards love.
Why This Script Is “Blog-Authority Level”
- Uses official EPEVER register map
- Minimal dependencies
- Handles real-world serial noise
- Clean error handling
- Production-safe polling interval
- No cloud dependency
This isn’t demo code.
This is field-ready infrastructure.
Optional Enhancements (Great for “Next Steps” Section)
You can later extend this script to:
- Calculate battery percentage
- Estimate time-to-empty
- Track daily solar yield
- Add Telegram alerts
- Store temperature sensors
Each enhancement becomes a new blog section or YouTube embed opportunity.
Installation One-Liners
The beauty of this stack is how simple it installs:
- InfluxDB:
One service. One port. One job. - Grafana:
Auto-starts. Web UI ready instantly.
Minimal moving parts. Maximum clarity.
6. Building Your First Dashboard
This is where your system starts talking back.
Connecting Grafana to InfluxDB
Grafana treats InfluxDB as a “data source.”
Once connected, everything becomes modular:
- Voltage panels
- Current panels
- Power graphs
- Battery state indicators
You aren’t locked in.
You can iterate endlessly.
Creating a Battery “Fuel Gauge”
Instead of raw voltage numbers, create a gauge that shows:
- 100% → Fully charged
- 50% → Normal use
- 30% → Warning zone
This single visual does more than ten numbers ever could.
Optional Alerts (Highly Recommended)
Silence is dangerous in off-grid systems.
Set alerts for:
- Low voltage
- Rapid discharge rates
- Unusual nighttime drops
Telegram alerts work even on weak cellular links. Email works when everything else fails.
7. Remote Access (Without Port Forwarding)
Off-grid internet is messy.
- CGNAT
- Dynamic IPs
- Cellular modems
Port forwarding often isn’t even possible.
The Clean Solution: Private Tunnels
Tailscale or Cloudflare Tunnels create a secure path without exposing your network.
No firewall headaches.
No public IPs.
No security risks.
Open your dashboard from your phone—anywhere on Earth.
8. Troubleshooting Common Roadblocks
“No Serial Data”
Before panic:
- Swap RS485 A/B
- Confirm baud rate
- Check Modbus address
Most failures are wiring or addressing—not software.
SD Card Corruption
Time-series data writes constantly.
Protect your system by:
- Enabling log2ram
- Reducing write frequency
- Considering read-only root FS
These steps extend SD card life years longer.
Why Real-Time Solar Monitoring Matters in Off-Grid Homes
One of the biggest frustrations in off-grid solar systems isn’t failing equipment—it’s not knowing what’s happening in real time. As shown in the video, even a high-end inverter can leave you guessing if the only way to check system status is logging in, tapping through menus, or relying on unstable Wi-Fi. When power visibility isn’t instant, every decision—from running appliances to charging batteries—becomes uncertain.
From Guesswork to Clarity: The Case for Always-On Energy Dashboards
The real breakthrough isn’t the tablet or the screen—it’s having live energy data visible at a glance, every time you walk by. A local, always-on dashboard removes cloud logins, vendor lock-in, and networking headaches, replacing them with clarity and confidence. When your inverter, charge controllers, and batteries report to one simple display with historical logging, your off-grid system stops being a mystery—and starts becoming something you can truly manage and scale.
9. Conclusion & Next Steps
When you stop guessing, everything changes.
You stop reacting.
You start planning.
A local off-grid monitoring dashboard doesn’t just show numbers—it gives you agency. You know when to conserve. You know when to expand. You know when your system is aging before it fails.
And the best part?
You built it yourself.
No cloud dependency.
No subscription.
No black boxes.
Just clean data, quietly working for you—day and night.
What to Do Next
- Customize your dashboard layout
- Add weather correlation
- Track inverter load
- Share screenshots with the off-grid community
Your system is no longer blind.
I’m aware.
Can I monitor an EPEVER solar charge controller without using the cloud?
Yes. EPEVER controllers expose real-time data over Modbus RTU (RS485), allowing a Raspberry Pi to read battery, solar, and load metrics locally without any cloud services, subscriptions, or internet access.
What data can I realistically track with a Raspberry Pi solar dashboard?
You can track battery voltage, charge and discharge current, solar panel input, load power, historical trends, and daily energy production. With Grafana, this data is visualized in real time and stored long-term for performance analysis.
Is Raspberry Pi reliable enough for 24/7 off-grid monitoring?
Yes—when powered through a proper DC step-down converter and paired with a high-endurance SD card, a Raspberry Pi can run continuously for years in off-grid environments with minimal power consumption.
Do I need programming experience to build this solar monitoring system?
Basic Linux and copy-paste Python skills are sufficient. The system relies on proven libraries like minimalmodbus, and once configured, it runs automatically without daily interaction.
How do I access my off-grid solar dashboard remotely without port forwarding?
You can use tools like Tailscale or Cloudflare Tunnels to securely view your local Grafana dashboard from anywhere, even when your off-grid internet connection uses CGNAT or a cellular hotspot.